Alphabetical Index
Chemical Composition of Steels
Keyword Search
Steel Names
Alloyed Steels
Carbon Steels
Cast Irons
Chromium Steels
Cold Work Tool Steels
Creep Resistant Steels
Hot Work Tool Steels
Molybdenum Steels
PM steels
Stainless Steels
Structural Steels
Tool Steels
Vanadium Steels
White Cast Irons
M2C Carbides
M3C Carbides
M7C3 Carbides
M23C6 Carbides
MC Carbides
Light Microscopy
EDS/WDS Microanalysis
Scanning Electron Microscopy
Transmission Electron Microscopy
X-Ray Diffraction
Help
Contact Us
Home
(Cr,Fe)7C3, Fe3C and Fe23(C,B)6 carbides in white cast irons
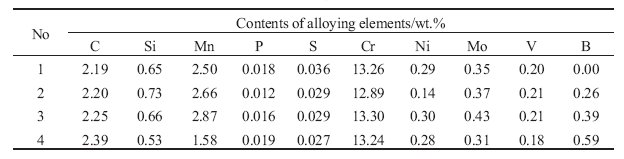
Table 1: Chemical compositions of the examined alloys.

Figure 1: Microstructure: a), b) alloy No. 1; c), d) alloy No. 2; e), f) alloy No. 3; g), h) alloy No. 4 (a, c,
e, g optical microphotographs; b, d, f, h SEM). Scale bars: 50, 10 µm.

Table 2: Results of quantitative microstructure analysis.
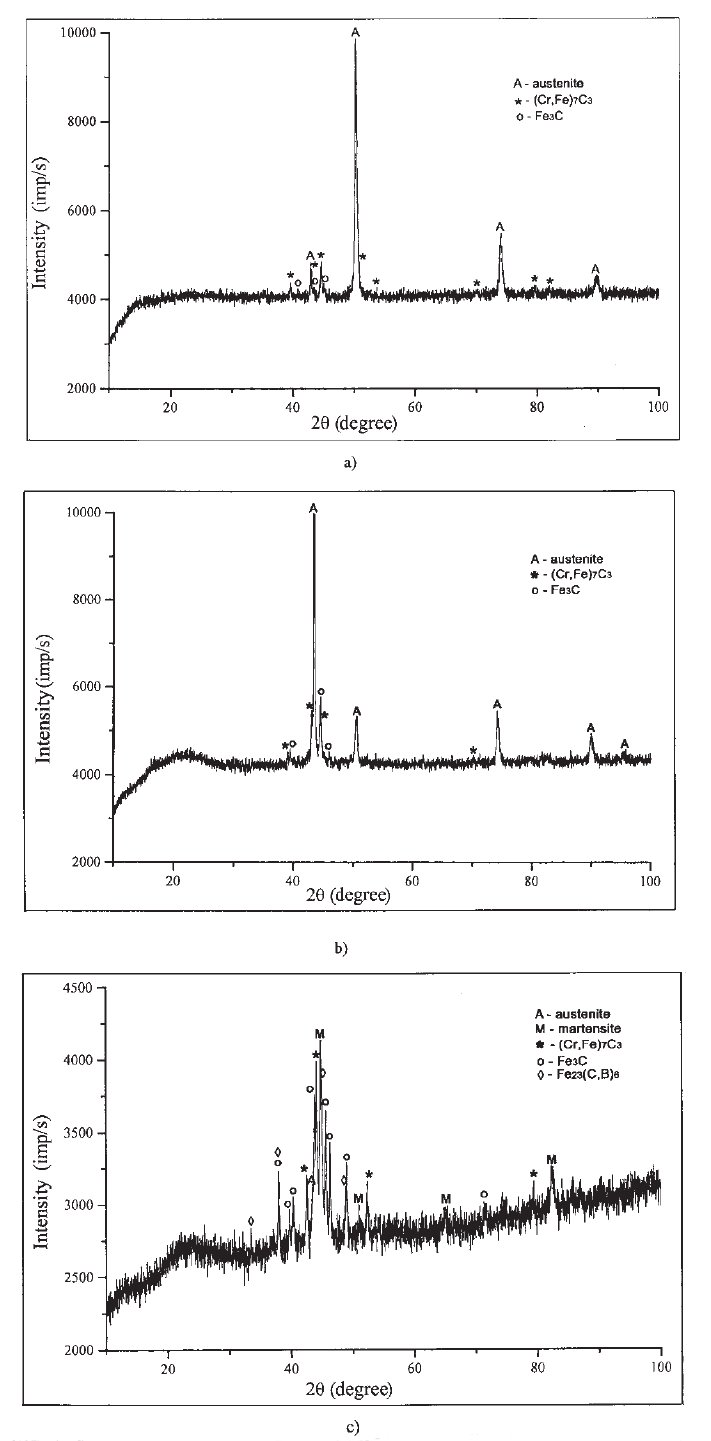
Figure 2: X-Ray diffractograms of: a) alloy No. 1; b) alloy No. 2; c) alloy No. 4. Cu Kalpha radiation.
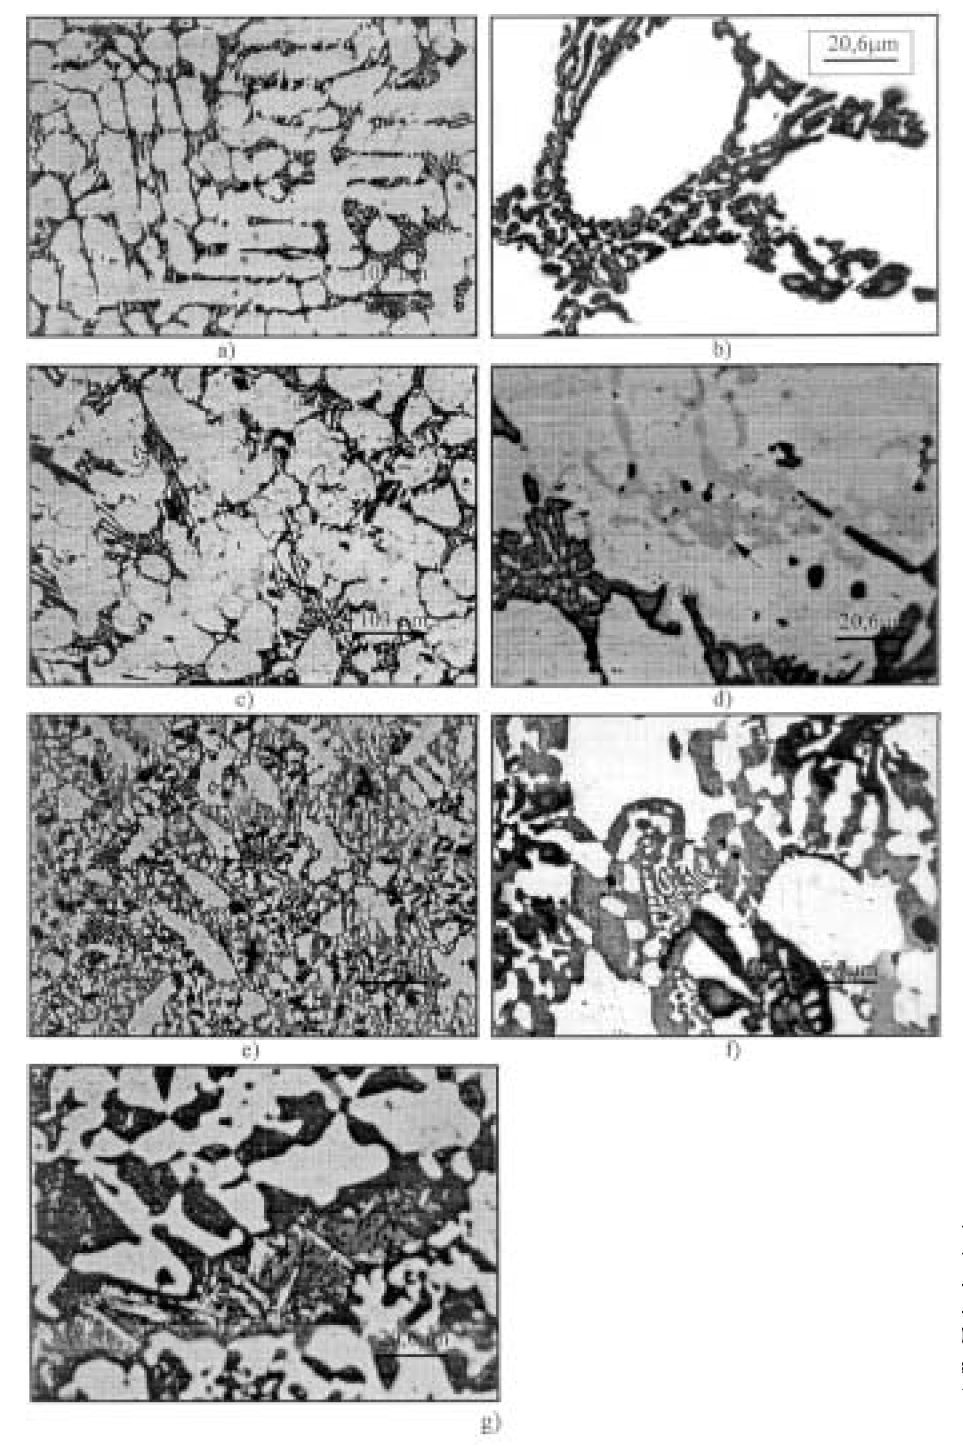
Figure 3: Carbide types in the examined alloys (samples etched in Murakami reagent); a), b) alloy No.1, M7C3 carbides; c), d) alloy No. 2, M7C3 (dark) and M3C (gray) carbides; e), f) alloy No. 4,M7C3 (dark),M3C (gray) and g) alloy 4 M23C6 carbides. Scale bars: 100, 20.6 µm.
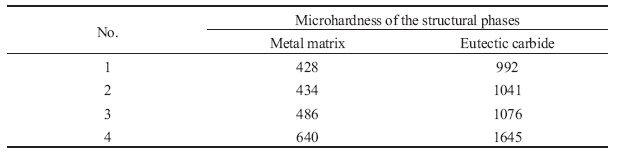
Table 3: Results of the microhardness of the structural phases.
Carbide name: (Cr,Fe)7C3, Fe3C, Fe23(C,B)6
Record No.: 1045
Carbide formula: (Cr,Fe)7C3, Fe3C, Fe23(C,B)6
Carbide type: M7C3, M3C, M23C6
Carbide composition in weight %: No data
Image type: LM, XRD
Steel name: White cast iron
Mat.No. (Wr.Nr.) designation: No data
DIN designation: No data
AISI/SAE/ASTM designation: No data
Other designation: No data
Steel group: White cast irons
Steel composition in weight %: See the table 1.
Heat treatment/condition: Alloy No. 1 is the basic alloy, and the alloys No. 2, 3 and 4 contain boron in the amount of 0.26, 0.39 and
0.59 %, respectively. The contents of other alloying elements were approximately the same for all the examined
alloys, as can be seen from Table 1.
The examined alloys were melted in a 50 kg medium frequency induction furnace, and cast in moulds
prepared by CO2 technology with the morphology of digging teeth. The examined samples
were cut out from such castings, at positions where the thickness of the teeth was approximately 50 mm.
Note: The effect of boron, in the amounts of 0.26, 0.39, and 0.59 wt.%, on the volume
fraction and structure of carbides in Cr white irons was examined. It was demonstrated that
the addition of boron can change the microstructural characteristics of white iron containing
about 13 wt.% Cr. With increasing boron content, the volume fractions of M3C carbide increase,
but the volume fracton of M7C3 carbide remains unchanged. The addition of boron
tends to produce hard borides and/or borocarbides. It also prevents the formation of pearlite,
which results in alloys possessing good wear resistance.
The microstructures of the examined alloys are shown in Fig. 1. Detailed analysis confirmed
that the structure obtained in this investigation is typical for chromium white cast iron.
The base alloy (No. 1) is characterized by the presence of primary austenitic dendrite and a
eutectic that consists of eutectic carbides and eutectic austenite. The structure of the other alloys
also consists of a primary phase and an eutectic, but the following differences can be noticed:
With increasing boron content, the dendritic structure slowly disappears, while the primary
phase obtains the form of isolated islands surrounded by the eutectic (Fig.1c, e, g). In the presence of boron, the primary phase becomes a mixture of austenite and
martensite. The degree of martensite tranformation increases with increasing boron content.
The development of this transformation can be seen on the SE microphotographs (Fig. 1 d, f, h).
X-Ray diffractograms of the alloys No. 1, No. 2 and No. 4 are presented in Fig. 2a c.
Looking at the diffractograms in Fig. 2, it can be noticed that the diffractograms of the
alloys No. 1 and No. 2 are very similar and clear. This is the consequence of good crystallization
of the structural phases.
On the diffractogram No. 1, the peaks labeled with A belong to austenite (diffraction
cards 23298)*. Apart from austenite, two types of eutectic carbides have been detected in
the structure of basic alloy (alloy No. 1 in Table 1):
(Cr,Fe)7C3 (diffraction card 5-720) peaks labeled with*, and
Fe3C (diffraction card 35-772) peaks labeled with o.
By measuring the area under the highest peak, which belongs to austenite, positioned
at the angle 2theta = 50.191 and the area under the highest peak, which belongs to the carbide,
positioned at the angle 2theta = 45.091, the volume fraction of carbide alloy No. 1 is obtained
and its value is approximately 9%. The rest up to 100% is the volume fraction of austenite
(primary and eutectic).
According to the diffractogram belonging to alloy No. 2 (Fig. 2b), the austenite (peaks
labeled with A), the carbide (Cr,Fe)7C3 (peaks labeled with*) and carbide Fe3C (peaks labeled
with o) also constitute to the structure of this alloy.
Proceeding with the calculations in the same way as for alloy No. 1, i.e., by measuring
the area under the highest peak which belongs to austenite (detected at 2theta = 43.374) and the
area under the highest peak that belongs to the carbide (detected at 2theta = 44.450) ,the volume
fraction of carbide in alloy No. 2 is obtained to be 20.5 % (see Table 2).
The diffractogram which belongs to alloy No. 4 is different from the previous two.
Due to the presence of a greater number of phases, the number of diffraction lines is much larger which makes this diffractogram much more complex, compared with the diffractograms
of alloys No. 1 and No. 2.
The peaks labeled withMbelong to martensite. The peak labeled with Abelongs to
austenite, the peaks labeled with * belong to the (Cr, Fe)7C3 carbide, the peaks labeled with
o belong to the Fe3C carbide and the peaks labeled with <> belong to the Fe23(C, B)6 secondary
carbide (diffraction card 12-570).
By measuring the area under the highest peak which corresponds to the metal matrix
(in this case it is the peak that arising from martensite) detected at an angle 2theta = 44.758 and
the area under the highest peak that belongs to the carbide phase, detected at 2theta = 44.070,
the volume fraction of the carbide phase in alloy No. 4 was determined to be 47.4 %.
Additional carbide type identification was performed by selective etching of the samples
of the examined alloys in Murakami reagent (Fig. 3). Using the same alloys, the volume
fraction of each eutectic carbide types was detected (Table II), by measuring the segments
produced by the test lines on the examined phases. The structure of alloy No. 1
etched by Murakami reagent is presented in Fig. 4a and b. Only the M7C3 carbide in an
amount of 13.25 % is present.
On the microphotograph of alloy No. 2 (Fig. 3c and d), the presence of two carbide
types (dark phase M7C3 and gray phase indicated by the dark arrow in Fig. 3d M3C)
can be noticed. The volume fraction of the carbide phase in alloy No. 2, obtained by measuring
the segments produced by the test lines on the examined phase, is 19.96%(17.47%
M7C3 and 2.49%M3C, Table II). This result is absolutely in accordance with the result
obtained by X-ray diffraction analysis, where a value of 20.5 % was obtained.
Bearing in mind the great similarity between alloy No. 2 and alloy No. 3 detected during
the examination of the microstructural and mechanical properties, in order to reduce the
number of tests, the volume fraction of each particular type of eutectic carbides in the third
alloy was not analyzed. Only the total quantity of carbide phase was calculated to be 24.77
% (see Table 2).
Finally the presence of three types of carbides: eutectic M7C3 (dark phase Fig. 3e
and f) and M3C(gray phasae Fig. 3e and f) and secondaryM23C6 (small dark lines in the
gray phase (metal matrix) Fig. 3g) were detected. In this alloy, the total carbide volume
was 51.27% (Table 2), which is in accordance with the results obtained by X-ray diffraction
analysis, where a volume of 47.4 % was determined.
From X-ray diffraction analysis and selective etching, it was concluded that the eutectic
M7C3 and M3C carbides are present in the structure of all the alloys. In alloy No. 4, apart
from eutectic carbides, secondaryM23C6 carbides are also present (Fig. 2c and Fig. 3g).
The results of the measurement of the microhardness are given in Table 3. As can be
seen from Table 3, increasing the boron content from 0 to 0.59% causes the metal matrix microhardness to increase from 428 to 640 HB, and the microhardness of the eutectic carbides
to increase from 992 to 1645 HB. It can also be noticed that at lower boron contents,
the rate of increase of the microhardness is low, whereas in the fourth alloy with the maximal
boron content the microhardness had increased drastically.
Links: No data
Reference: Not shown in this demo version.