Alphabetical Index
Chemical Composition of Steels
Keyword Search
Steel Names
Alloyed Steels
Carbon Steels
Cast Irons
Chromium Steels
Cold Work Tool Steels
Creep Resistant Steels
Hot Work Tool Steels
Molybdenum Steels
PM steels
Stainless Steels
Structural Steels
Tool Steels
Vanadium Steels
White Cast Irons
M2C Carbides
M3C Carbides
M7C3 Carbides
M23C6 Carbides
MC Carbides
Light Microscopy
EDS/WDS Microanalysis
Scanning Electron Microscopy
Transmission Electron Microscopy
X-Ray Diffraction
Help
Contact Us
Home
Carbides in the S 390 PM and S 690 PM steels II
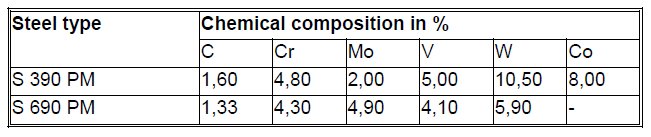
Table 1: Chemical composition of the steels.
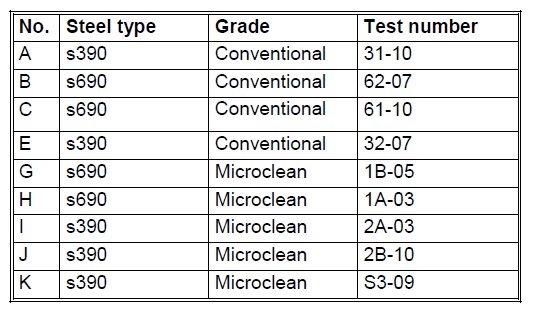
Table 2: Test specimens used for cross section observations.
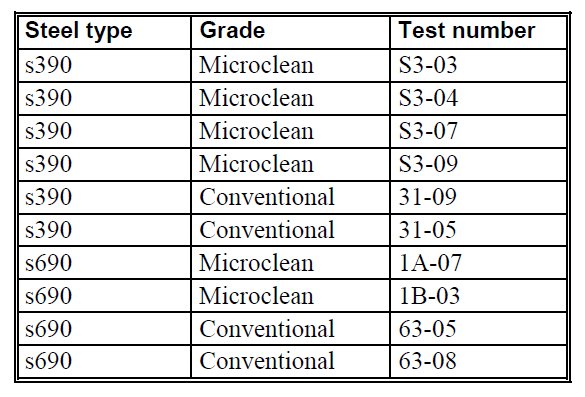
Table 3: Test specimens used for fracture surface observations.
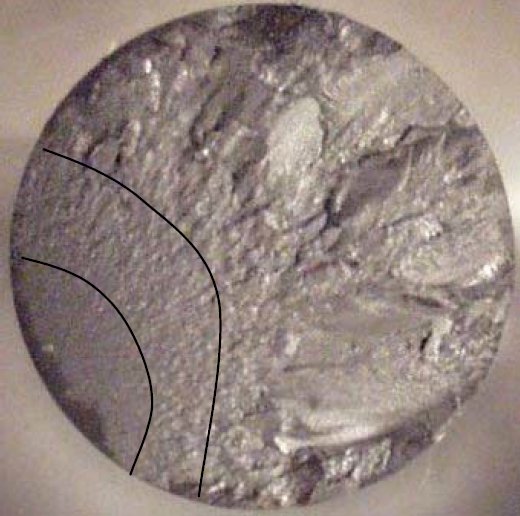
Figure 1: Fracture surface on test specimen with crack initiation (left), initial fracture (middle) and final fracture (right) areas.
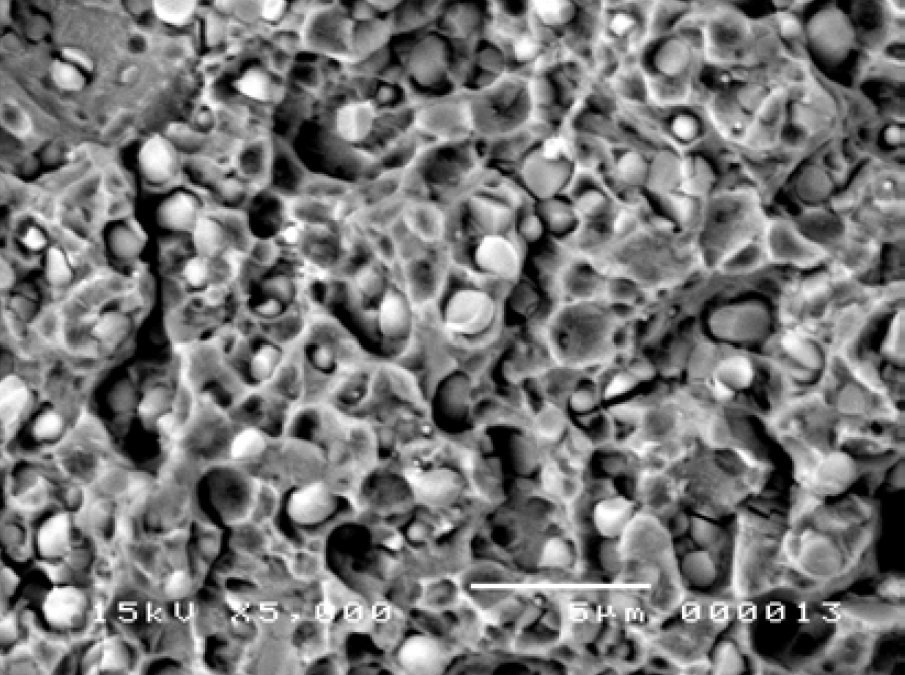
Figure 2: Typical image of fracture surface used for counting fractured carbides. Scale bar: 5 µm.
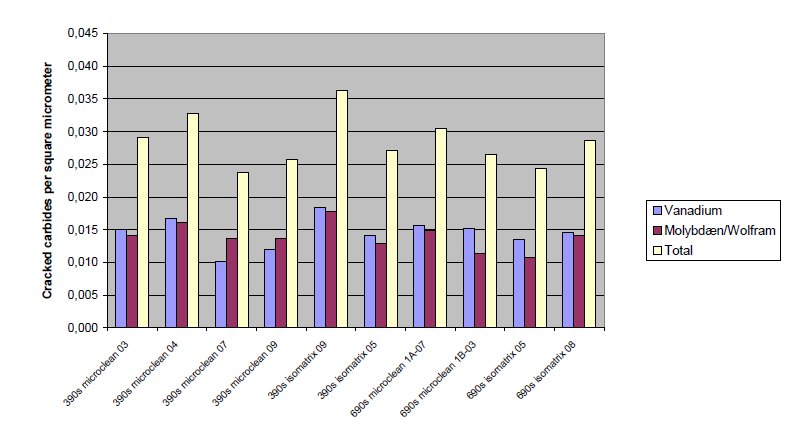
Figure 3: Average numbers of cracked carbides per µm² on the entire sample area.
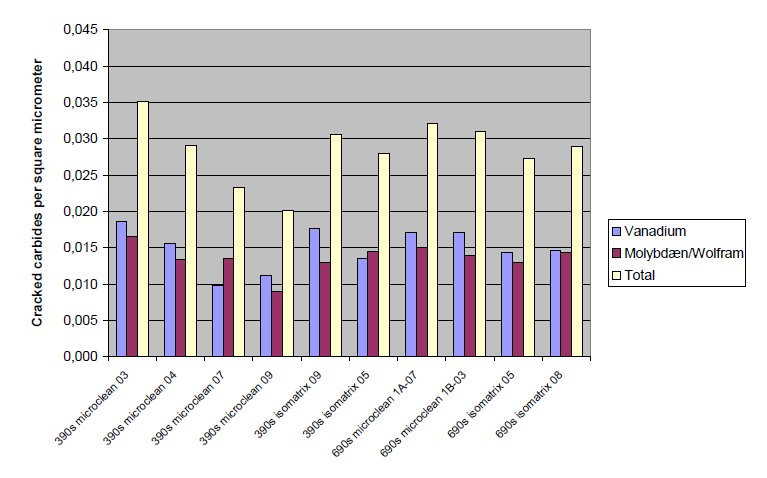
Figure 4: Average numbers of cracked carbides per µm² on the crack initiation region.
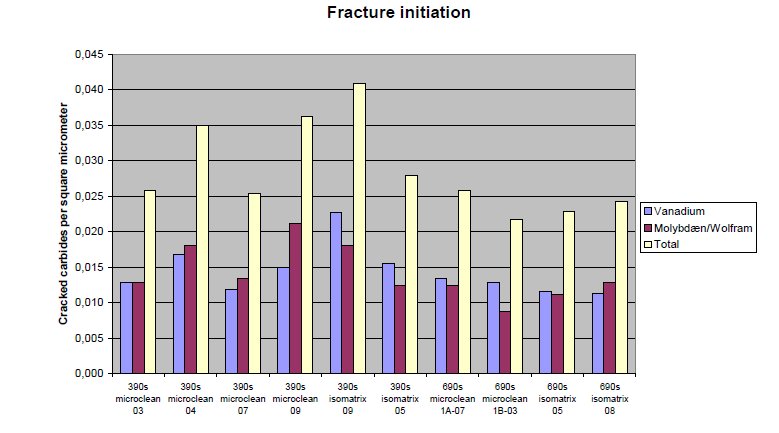
Figure 5: Average numbers of cracked carbides per µm² in the initial fracture region.
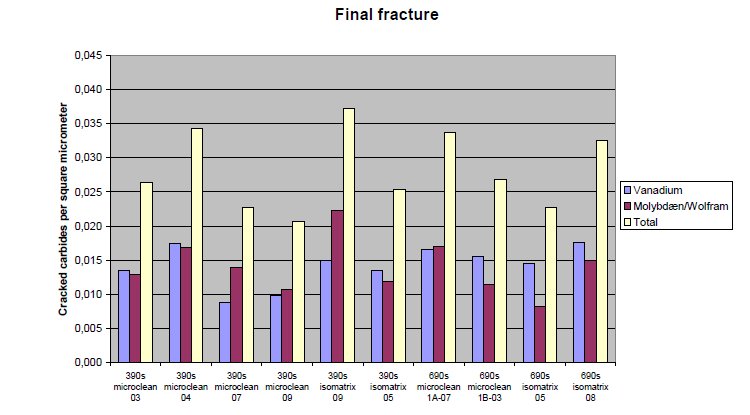
Figure 6: Average numbers of cracked carbides per µm² in the final fracture region.
Carbide name: M6C, V8C7
Record No.: 735
Carbide formula: M6C (M=Fe, W, Mo), V8C7
Carbide type: M6C, M8C7
Carbide composition in weight %: No data
Image type: SEM, X-ray
Steel name: S 390 PM, S 690 PM
Mat.No. (Wr.Nr.) designation: No data
DIN designation: No data
AISI/SAE/ASTM designation: No data
Other designation: No data
Steel group: PM high speed tool steels
Steel composition in weight %: See the table 1.
Heat treatment/condition: The steels investigated were two PM High speed tool steels supplied by Böhler Edelstahl. The chemical composition of the steels are given in Table 2-1. Both steel types were supplied in a conventional (ISOMATRIX) and a MICROCLEAN grade. The specimens used were standard shouldered test specimens optimised to reduce stress concentra-tions in the transition area.
Note: The fracture surfaces of fatigued specimens were investigated using scanning electron microscopy (SEM) and energy dispersive x-ray spectroscopy (EDS). The aim was to quantify the distribution of cracked carbides and non-metallic inclusions on the fracture surfaces as well as on polished cross sections. The specimens were made of Böhler P/M steel grade 390s and 690s in both micro-clean and conventional grades.
The results show that the content of non-metallic inclusions are higher in the conventional grades than in the microclean grades, but there were found to be no link between non-metallic inclusions and the crack initiation. Surprisingly, no differences were found between the carbide size distributions of the micro-clean and conventional grades. Also, the distribution of the fractured carbides was found to be the same regardless of steel type, manufacturing method or location on the specimen.
For the investigations in SEM the fracture surface was divided into 3 areas: crack initiation, initial fracture and final fracture (see Figure 1). The crack initiation was investigated with SEM concerning abnormalities, e.g. carbide clusters or non-metallic inclusions. Afterwards the fracture surfaces were treated with 15g Alconox in 350 mL water preheated to 60°C. The solution containing the fracture surface was then placed in an ultra sonic cleaner for about 30 minutes and afterwards cleansed with water and acetone. This procedure is described in more details in literature. The treated fracture surfaces were then examined in SEM. 5 images were recorded at 5000x magnification in each of the three areas i.e. a total of 150 images. The number of fractured carbides was counted manually on the recorded images. A typical image of the fracture sur-face is shown in Figure 2.
As described, the fracture surfaces were divided into three regions: crack initian area, initial fracture and final fracture (see Figure 1). The number of fractured carbides was counted within each of these regions in order to reveal any possible differences in densities of fractured carbides. When counting frac-tured carbides manually, a certain amount of subjectivity will be present. The same criteria for determining whether a carbide is cracked or not, has been ap-plied for all of the images recorded, which give the relative numbers credibility. Thus, any differences between the three regions should be spotted with this method.
The results are given in the histograms on Figs. 3-6. The histograms show that there are no clear differences in densities of fractured carbides, neither be-tween the three regions nor between the different steel grades. As expected, this suggests that the deformation has been homogeneously distributed in the gauge volume.
When comparing the carbide size distributions of the grade 390s conventional and the microclean tool steel no differences are observed. In the grade 690s the microclean contain fewer small (0.1-0.6 µm) carbides than by the conventional. Mutually the 390s and 690s contain the same area fraction of carbides regard-less of manufacturing method.
Links: No. 734, No. 735 and No. 736
Reference: Not shown in this demo version.