Alphabetical Index
Chemical Composition of Steels
Keyword Search
Steel Names
Alloyed Steels
Carbon Steels
Cast Irons
Chromium Steels
Cold Work Tool Steels
Creep Resistant Steels
Hot Work Tool Steels
Molybdenum Steels
PM steels
Stainless Steels
Structural Steels
Tool Steels
Vanadium Steels
White Cast Irons
M2C Carbides
M3C Carbides
M7C3 Carbides
M23C6 Carbides
MC Carbides
Light Microscopy
EDS/WDS Microanalysis
Scanning Electron Microscopy
Transmission Electron Microscopy
X-Ray Diffraction
Help
Contact Us
Home
Carbide Extraction From the Weldox Steel

Table 1: Chemical composition of the investigated steels.
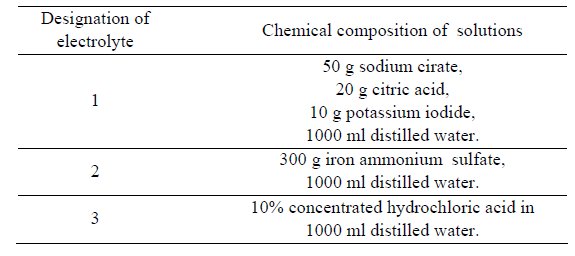
Table 2: The composition of electrolytesolutions applied for the anodic
dissolution of the investigated steels by PN 64/H-04510.
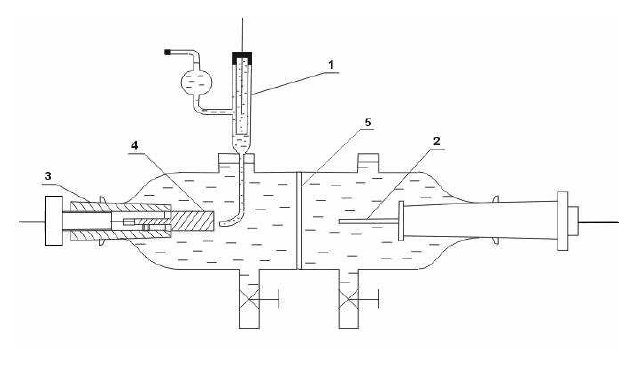
Figure 1: Diagram of an electrolyzer for the anodic solution of
Weldox steels: 1-Haber-Lugin capillary with a reference
electrode, 2-auxiliary electrode (cathode), 3-holder of the tested
electrode, 4-sample (anode), 5- diaphragm made of sinter glass.
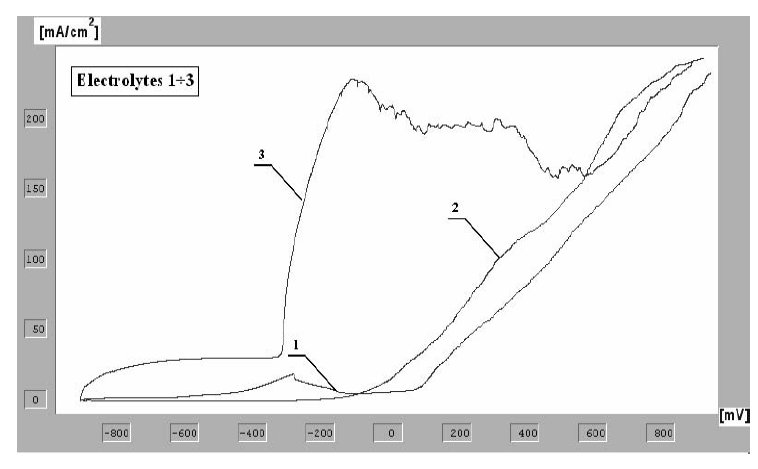
Figure 2: Potentiodynamic curves of the anodic polarization for Weldox
1300 steel obtained by the method of linear voltamperometry for
various electrolytic solutions.
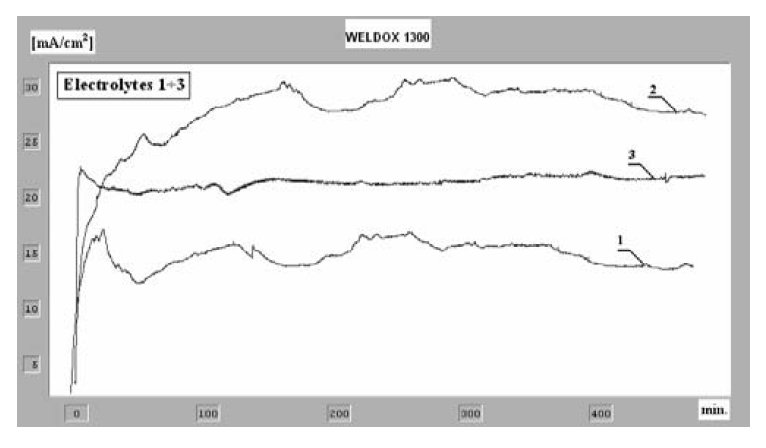
Figure 3: Chronoamperometric curves of the anodic polarization for
Weldox 1300 steel in various electrolytic solutions.
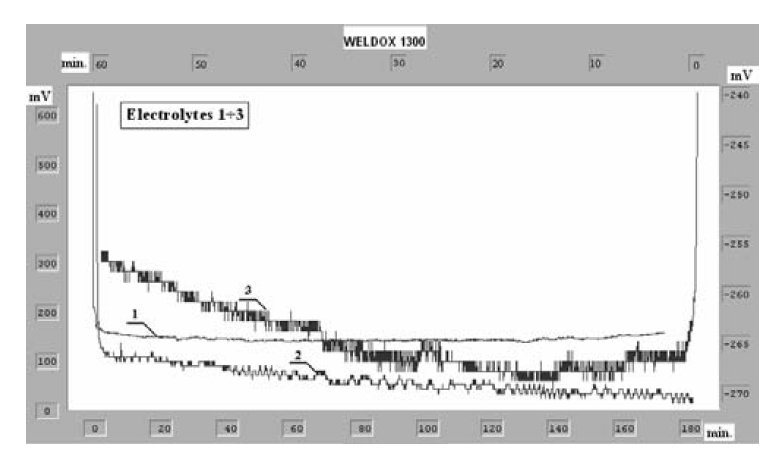
Figure 4: Chronopotentiometric curves of the anodic polarization for
Weldox 1300 steel in various electrolytic solutions.
Investigations were carried out on high-resistant microalloyed
constructional Weldox steels, resulting from industrial smelting in
the Swedish firm SSAB (Oxelösund). The chemical composition
of the investigated steels is to be seen in Table 1. The material
was supplied in the form of steel sheets, with a thickness of 20 mm (Weldox 900) and 10 mm (Weldox 1300). These sheets were
sampled for anodic dissolution (Ø7 mm and Ø15 mm and the
length 40 mm) and measurements of their hardness and for
metallographic investigations. The hardness of steel Weldox 900
in the delivered state amounts to about 34 HRC, and that of
Weldox 1300 to about 48 HRC. Metallographic observations have
revealed in these steels a fine dispersive structure of tempered
martensite with various morphologies.
Electrochemical investigations comprised the determination of
the active potential of dissolution of the investigated steels in various
chemical reagents (Table 2) and anodic dissolution both by means of
the chronopotentiometric method (at a constant current) and the
chronoamperometric method (at a constant potential.
The dissolution of electrochemically active phases in a given
electrolyte solution was controlled potentiostatically by keeping
the given potential versus the reference electrode (saturated
calomel electrode, SCE). For this purpose curves of anodic
polarization I=f(E) were plotted determining the dependence of
the rate of dissolution on the assumed potential, and the ranges of
active dissolution and anodic passivation of the metal were found.
The dependence permitted to determine the potentional, at which
the ratio of the dissolution rate of the matrix versus the
precipitation reaches the highest values.
The anodic polarization curves of the investigated steels were
determined potentialdynamically making use of a glass
electrolyzer (Fig. 1) and a PGP 201 potentiostat from the firm
Radiometric Copenhagen which is a part of the system
VoltaLab21 cooperating with the personal computer.
The curves of anodic polarization determined for various
solutions are to be seen in Fig. 2.
Chronoamperometric and chronopotentiometric curves of the
anodic dissolution of Weldox 1300 steel in the investigated
solutions have been presented in Figs. 3. and 4.
X-ray investigations of electrolytic extractions were run by
means of an X-ray diffractometer type XRD 7, produced by
Seifert-FPM, applying the radiation of an anode CoKalpha and a Fe -
filter. Electrolytic extractions, deposited on a filter paper were
analyzed within the range of angles 2theta from 1 deg 2theta. The
step-scanning method was used at a step value of 0.1 deg 2heta and a
time of measurements amounting to 7 seconds in one
measurement position. The obtained diffraction patterns were
analyzed applying the program Diffract AT Search/Match.
Reference: W. Ozgowicz, A. Kurc, G. Nawrat, Identification of precipitations in
anodically dissolved high-strength microalloyed Weldox steels, Archives of Materials Science and Engineering, Volume 31, Issue 2, June 2008, pp. 96-97.