Alphabetical Index
Chemical Composition
Keyword Search
Named Inclusions
Steel Index
Exogenous Inclusions
Indigenous Inclusions
Macro Inclusions
Micro Inclusions
Nano Inclusions
Iron Oxide Inclusions
Nitride Inclusions
Oxide Inclusions
Phosphide Inclusions
Silicate Inclusions
Spinel Inclusions
Sulfide Inclusions
Refractory Inclusions
Slag Inclusions
Figure Browser
Help
Contact Us
Home
Al oxide, Ti-Al oxide, TiN, Al-Mg oxide inclusions in low carbon steel
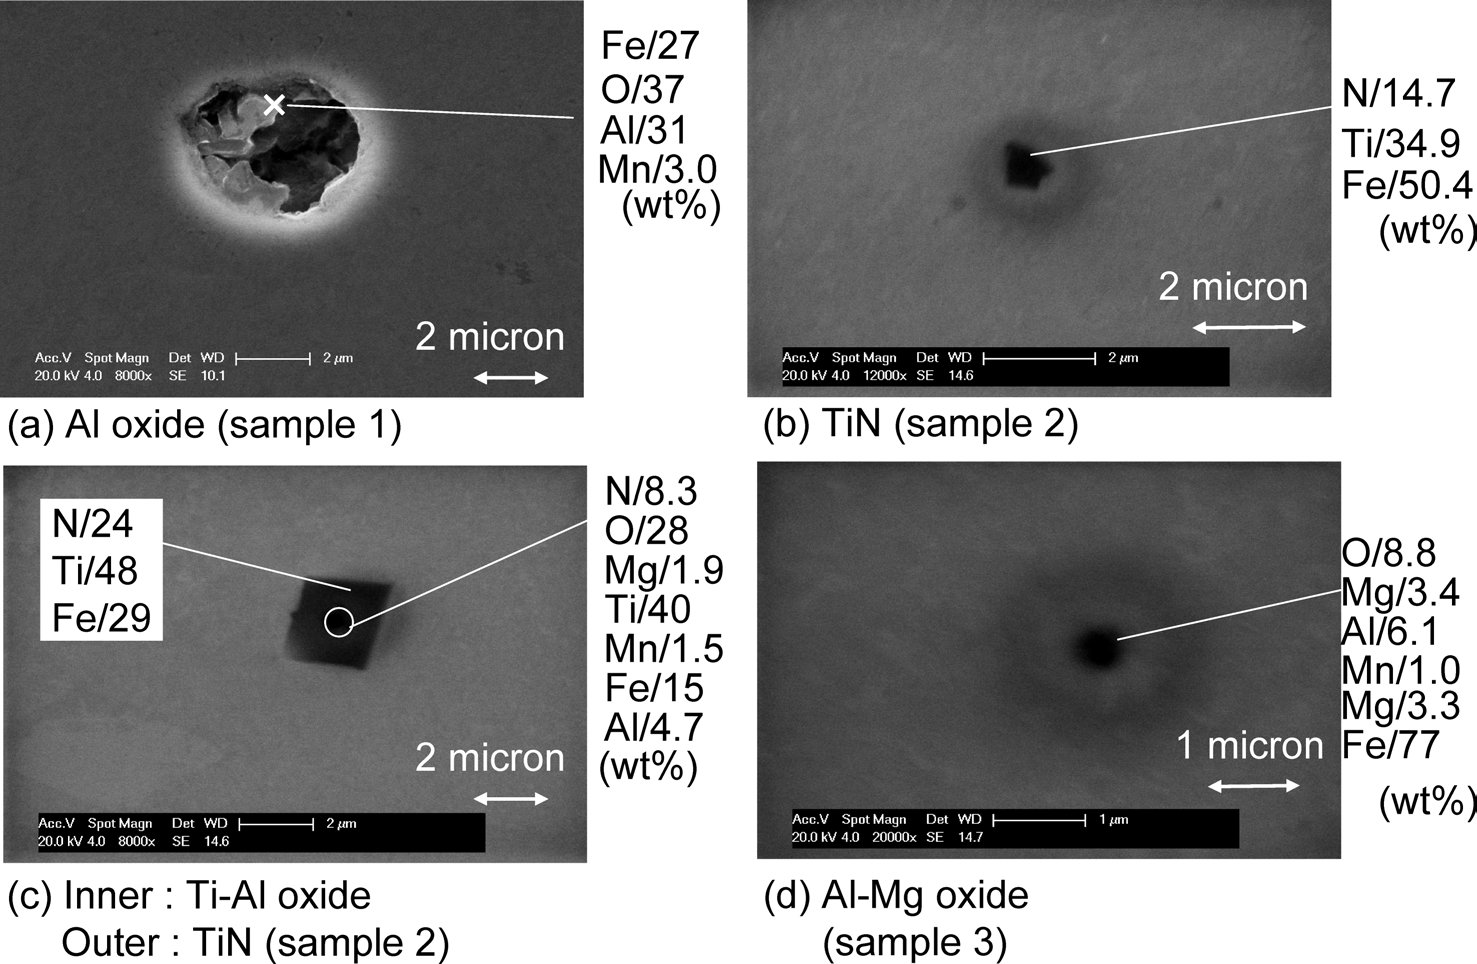
Figure 1: Typical inclusions in samples 1, 2 and 3. SEM, scale bars: 1, 2 µm.
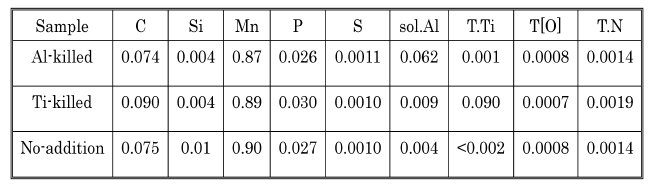
Table 1: Compositions of steel samples (wt%).
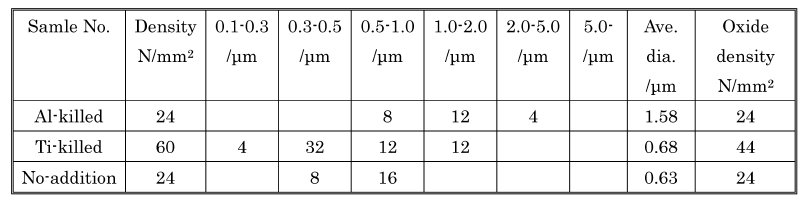
Table 2: Inclusion populations of steel samples.
Inclusion name: Al oxide, Ti-Al oxide, TiN, Al-Mg oxide
Record No.: 861
Inclusion formula: No data
Inclusion type (Macro/Micro/Nano): Micro
Inclusion type (Exogenous/Indigenous): Indigenous
Inclusion classification: Oxide, nitride
Inclusion composition in weight %: No data
Sample: Low carbon steel
Steel composition in weight %: Chemical compositions of samples obtained through the de-oxidation tests are listed in upper table. Samples 1, 2 and 3
are Al-killed, Ti-killed and no-addition samples respectively that are to be used for reasons of comparison.
Note: The effect of inclusions, generated during de-oxidation and solidification, of low carbon (0.07 wt%) and high manganese (0.9 wt%) steels, on the rates of migrations of the boundaries between delta ferrite/gamma-austenite interfaces, during austenite formation was investigated. The presence of two types of de-oxidation products were investigated, namely Al2O3 (13 µm) in Al-killed steel samples, and TiAl(Mg)O (0.31 µm) in Ti-killed steel samples. The samples were prepared in a vacuum-induction furnace
and a Confocal Scanning Laser Microscope was used to image in real time the interface movement on the surface of the samples.
Representative examples of inclusion of samples are shown in Fig. 1. In the Al killed steel Al2O3 (13 µm) was found predominantly in form of clusters. In the non deoxidized
sample, AlMgO inclusions of sizes between 0.51 µm were found. The sources of Al and Mg in these inclusions, in sample 5, are not clear but most likely they result from unintentional interactions with the MgO crucible and the Al2O3 tube (oxygen sensor) during processing in the induction furnace). In the Ti de-oxidized samples, TiAl(Mg)O (0.30.5 µm) inclusions and TiN (0.51 µm) were found. The latter could be found by themselves ( Fig. 1(b)) but were most often found with an oxide in their core (Fig. 1(c)). Table 1 shows the inclusion size distribution, inclusion densities and oxide densities for samples. The precipitations of the inclusions have been discussed in an earlier publication). In the Ti-killed steel, inclusions were found to be smaller than in the Al killed sample and inclusion density is higher than those in the Al-killed and no-addition samples. In Ti-killed steel, oxygen content was lower than the equilibrium oxygen content) with the expected Ti-oxide phase Ti3O5 during the de-oxidation process prior to casting. Furthermore, the oxide density increased with increasing the cooling rate during solidification. From these results, Ti oxides are considered to precipitate not as a primary de-oxidation inclusions but instead as
a secondary inclusion that precipitates during casting). On the other hand, in the Al-killed steel, inclusions were predominantly de-oxidation inclusions that precipitated in the
melt.
As for nitrides, nitrogen content in Ti-killed steel was 0.0019%, and the equilibrium nitrogen content with TiN was calculated to be 0.0016% by using thermodynamic data from literature). Calculations showed that TiN could precipitate at the temperature ranges below 1460°C. In order to observe the TiN precipitation and dissolution, insitu observation was carried out with CSLM. In this experiment, Ti-killed sample was heated up and cooled down repeatedly between room temperature and 1500°C. Both heating and cooling rates were 3°C/s. At the first cooling from 1500°C, TiN precipitation was observed at 1270°C, and during the next heating, TiN dissolved at 1300°C. From this observation, TiN was considered not to be present
in the temperature range (14401500°C) of this work. In the Al-killed steel, the nitrogen content was 0.0014%.
Reference: Not shown in this demo version.